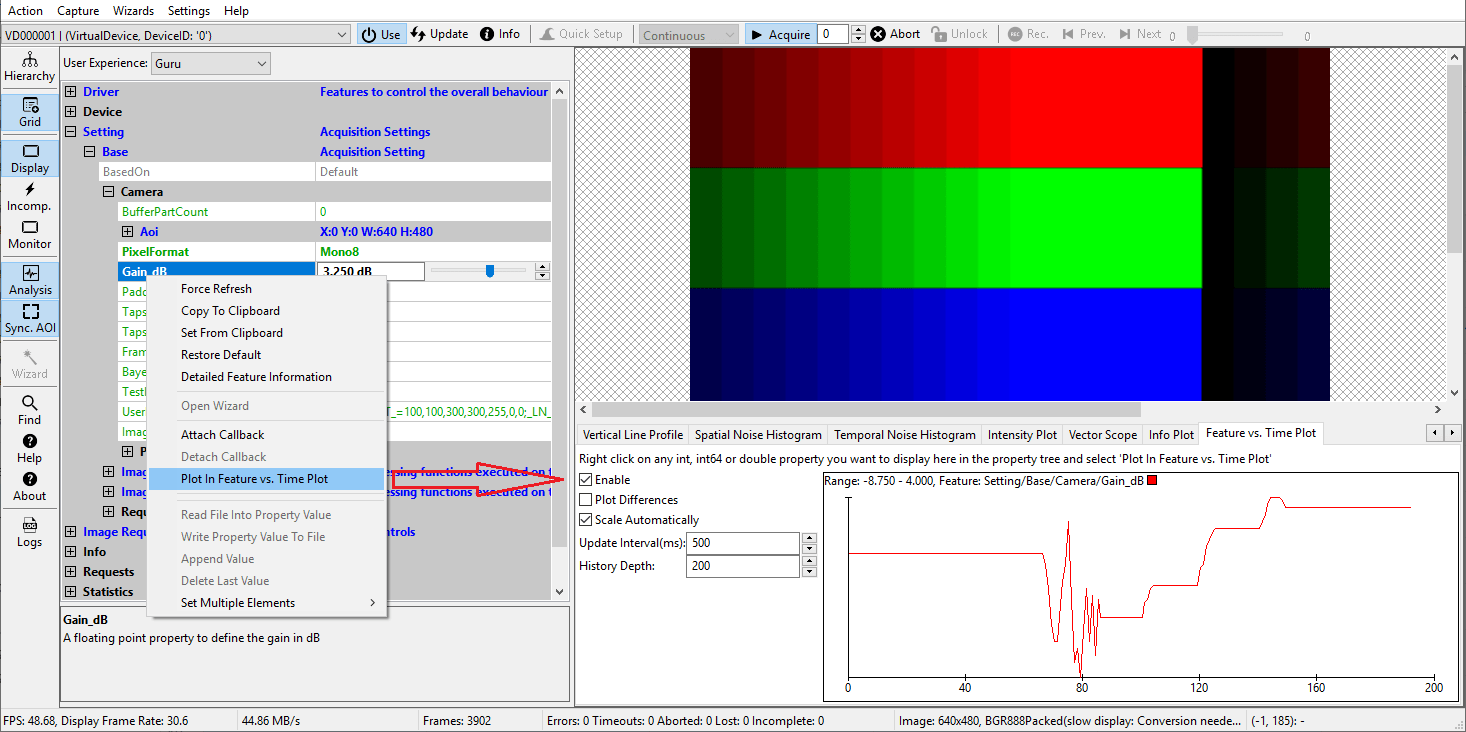
Feature Versus Time Plot
This control allows to display changes of an arbitrary property of time:

To use this plot
- "right-click" on the desired feature in The Property Grid
- select "Plot in Feature Vs. Time Plot"
- make sure the plot is enabled
- select a suitable history depth and update interval
Useful things that can be done with this feature include:
- check how the device temperature changes over time
- see how the exposure time or gain changes when a device performs AEC or AGC
- check how the properties "Statistics → ImageProcTime_s" or "Statistics → FormatConvertTime_s" change over time with changing AOIs or processing algorithms
- Note
- Only a single feature can currently be displayed in this plot. As soon as another one is selected the new feature will be plotted instead.
- Only integer or floating point properties can be attached to this control.
- See also
- Other Drawing/Display Options
