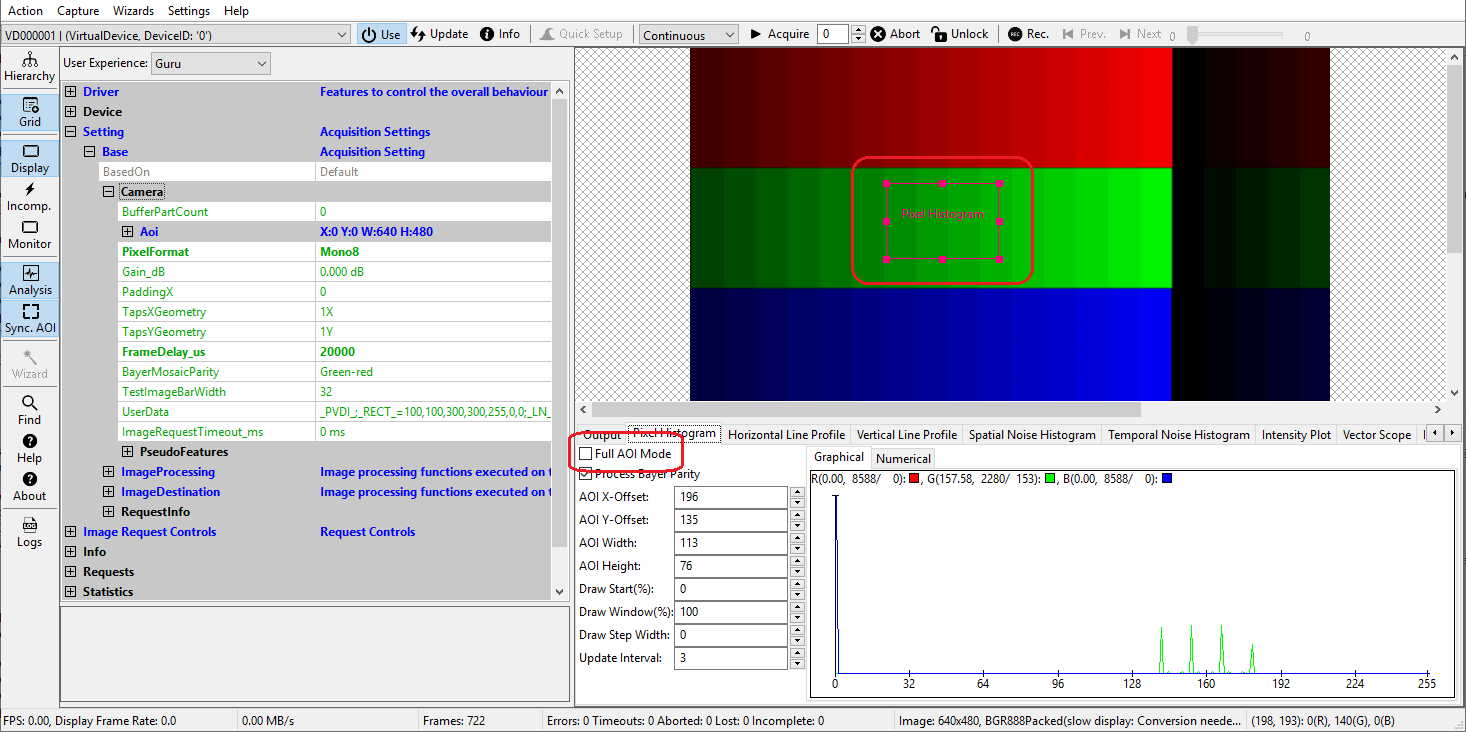
ImpactControlCenter comes with various controls that allow to perform some basic analysis of the images captured or imported from hard disk. Among these are elements to display various histograms and line profiles as well as information about images or properties over time.
Some of the analysis plots allow to switch between Graphical and Numerical display. On the numerical display a right-click on the data will allow to copy the full numerical data grid into the clipboard.
Analysis AOIs

Whenever an analysis plot offers a user selectable AOI, the currently defined AOI will be displayed on top of the image when the corresponding analysis plot is selected and the Full AOI Mode option for that plot is switched off. The AOI then can either be selected by using the AOI related spin buttons within the analysis tabs control area or by using the mouse within the image display area. When using the mouse:
- left-click anywhere within the AOI and hold down the mouse button to move the AOI
- move on any of the edges or corners of the AOI and press the left mouse button on any of the small squares displayed on top of the bounding box to change the size of the AOI
- left-click anywhere outside the AOI and hold down the mouse button to draw a completely new AOI
Synchronize AOIs
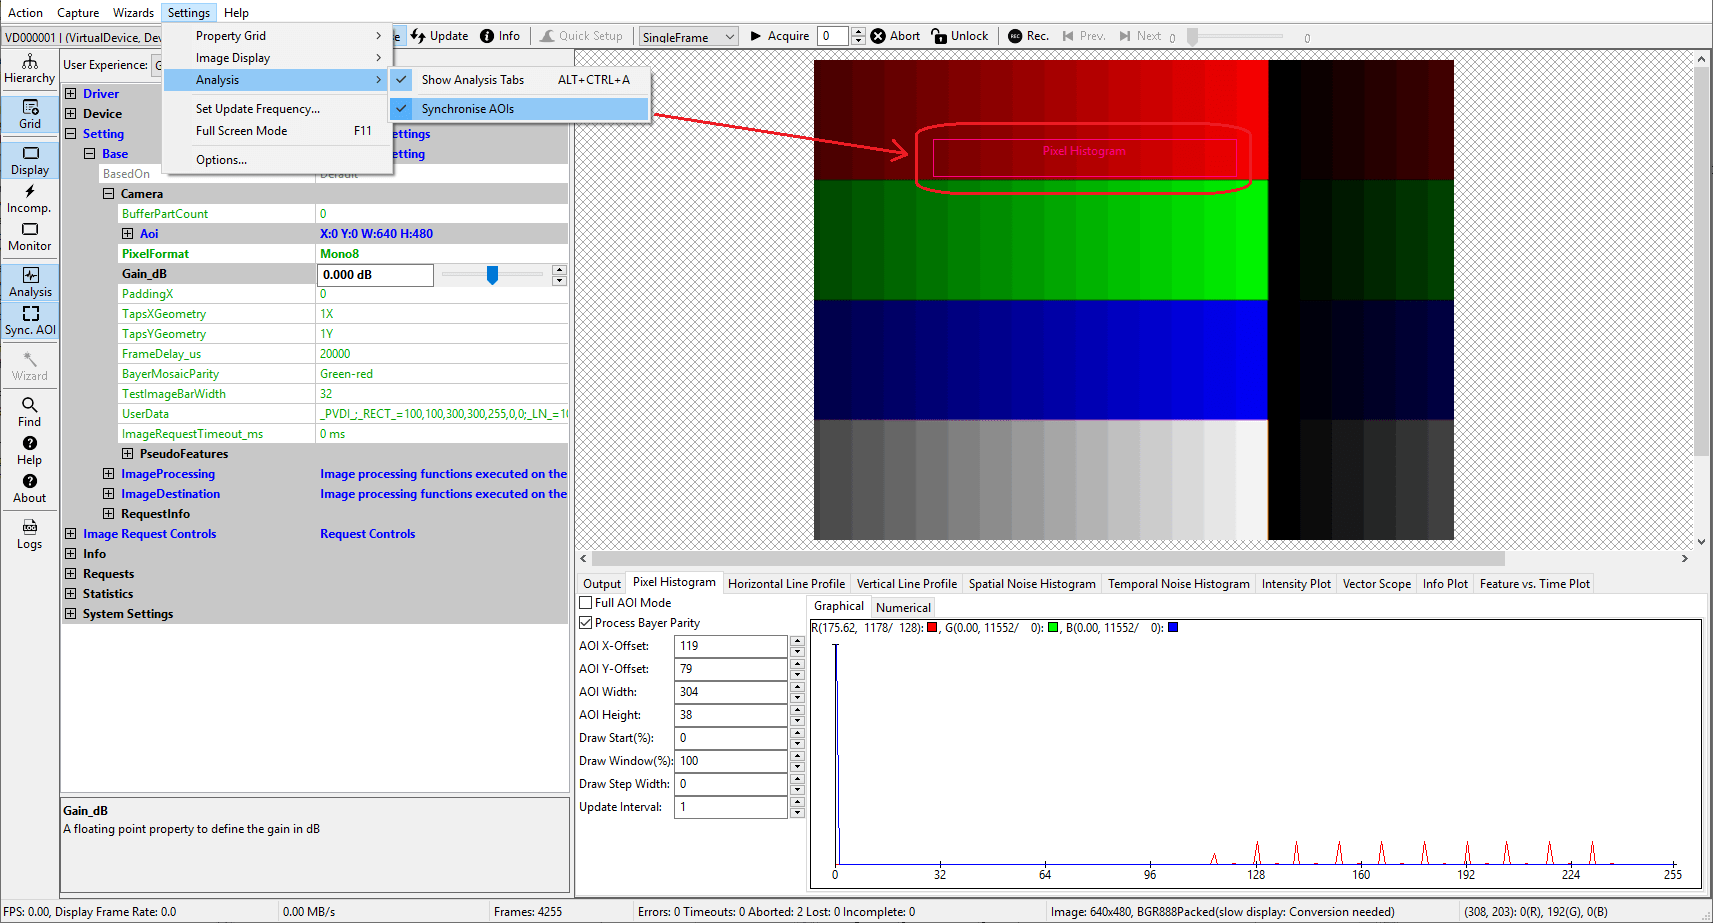
The AOIs for the individual analysis tabs can be configured independently from all the other tabs and all settings will be stored across sessions. When closing ImpactControlCenter and restarting it later the last configuration will be restored. Sometimes however it might be useful to use the same AOI for ALL analysis tabs. This can be configured by enabling the "Synchronize AOIs" option:

Other Drawing/Display Options
Some of the analysis plots will provide additional controls to configure the way the resulting data will be displayed.:
- "Full AOI Mode": Instead of using the configured AOI to calculate analysis data the full image will be processed. The current AOI settings however will be preserved and can be reactivated by switching this option back to off.
- "Process Bayer Parity": When raw Bayer images are captured this option can be used to either treat this image as a single channel gray-scale image or treat it as a 4 channel (red, green, green, blue) image resulting in either one large data set or 4 smaller ones. The latter option might e.g. be useful to see differences in the 2 green components or can be used for white balancing an image by adjusting parameters until all 4 data sets are almost equal.
- "Plot Differences": Will display the delta between the current and the previous value instead of the value itself
- "Scale Automatically": Will automatically adjust the Y-axis of a plot to map the lowest value of the current value set to the intersection with the X-axis and the highest value to the upper limit of the plot. Enabling this option will constantly change the scale of the Y-axis
- "Draw Start(%)": Will define the start of the range of data to display relative to the full data available. E.g. if a histogram contains 256 entries and this value is set to 50, then only the upper half of the histogram will displayed. This value combined with "Draw Window(%)" will allow to zoom in on a certain range of the result data.
- "Draw Window(%)": Will define the range of data to display from the full data available. E.g. if a histogram contains 256 entries and this value is set to 50 while "Draw Start(\%)" remains 0 then only the lower half of the histogram will displayed. This value combined with "Draw Start(%)" will allow to zoom in on a certain range of the result data.
- "Draw Step Width": Will allow to define how many data points will be drawn. 0 will draw 256, 1 will draw every data point which e.g. for 16-bit data might be slow and other values draw a subset from the available data points and might result in rounding effects so e.g. might hide missing codes. Use this option carefully!
- "Update Interval": Allows to balance CPU usage versus update speed for the selected control. E.g. a value of 3 will only calculate and display updated data every third image or AOI movement.
"History Depth": This is e.g. supported by the Intensity Plot and defines the number of result data sets kept in memory. E.g. a value of 5 will result in this and the last 4 analysis results being kept and displayed. This result data sets will be generated either
- by consecutive images being fed into the analysis plot
- by modifying the AOI on the current image (e.g. by dragging it around)
- Note
- Not every option listed here will be available for every analysis control!
Copy Grid Data To The Clipboard
Since ImpactControlCenter version 1.11.0 it is possible to copy analysis data to the clipboard. The data will be copied in CSV style thus can be pasted directly into tools like Open Office™ or Microsoft® Office™.
To do this
- right-click on the specific analysis grid when in numerical display mode and
- select "Copy grid to clipboard" from the pop up menu.

From within this context menu also a printf style format string can be specified for the data grid in order to e.g. view the data e.g. in hexadecimal format.
