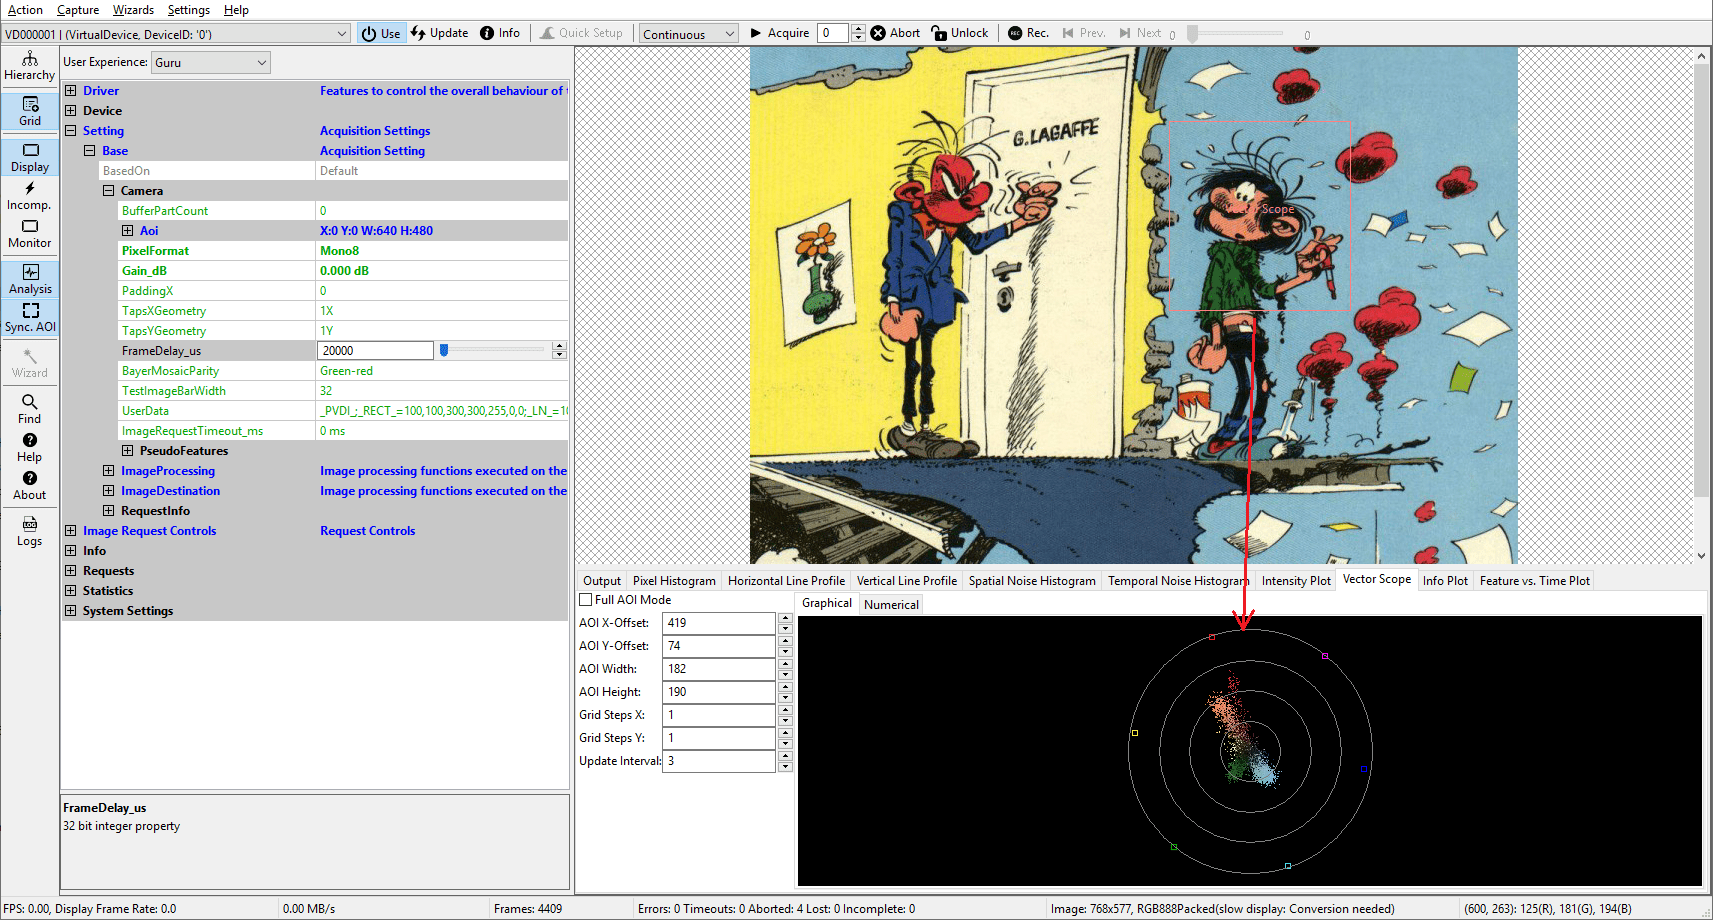
This plot will display the color distribution within a user selectable AOI within the analyzed image. Each color that is present in the AOI will result in a single dot in the resulting plot, so colors appearing only in a single pixel will be as prominent as a color occupying 99% of the AOI. This can be useful to check saturation, missing codes, fine tune the color fidelity and various other things:

In the center of the plot all pixels with similar intensities for all 3 color components of a pixel will end up. The farer out a pixel the more prominent 1 or 2 intensities of a 3 channel image are relative to the third component. So an RGB value of 255/0/0 will end up in the little red square of the plot, a value of 0/255/255 will end up in the little cyan square and so on.
- See also
- Other Drawing/Display Options
