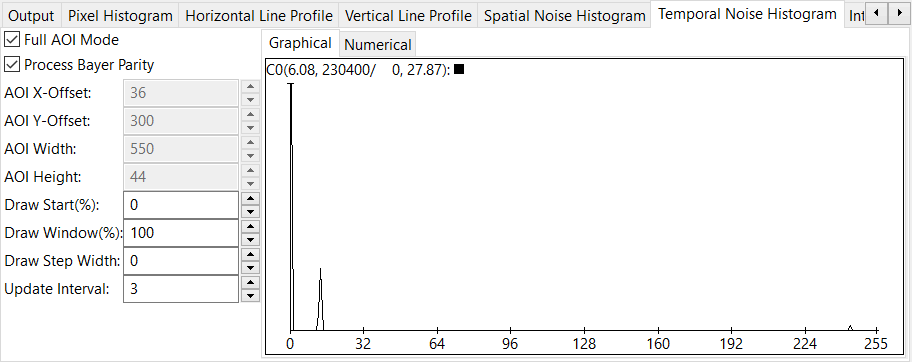
The temporal noise histogram shows the changes of a pixel from image to image. This method is more stable because it is relatively independent from the image content. By subtracting two images, the actual structure is eliminated, leaving the change of a pixel from image to image, that is, the noise assuming the sudden, massive changes in scene or lighting conditions can be neglected. When capturing images for this kind of analysis all parameters should stay constant, all automatic mechanisms(AGC, AEC, AWB, ...) have to be turned off and the image should not have underexposed or saturated areas. However, there are no picture signals without temporal noise. Light is a natural signal and the noise always increases with the signal strength. If the noise only follows the natural limits, then the camera is good. Only if additional noise is added the camera or the sensor isn't working perfectly.

For the information displayed in the upper region of the graphical view read: Channel (Mean difference, most frequent value count/ value, Standard deviation)
Example: For a single channel(Mono) image the output of 'C0(3.43, 5086/ 0, 9.25) will indicate that the mean difference between pixels in 2 consecutive images is 3.43, the most frequent difference is 0 and this difference is present 5086 times in the current AOI. The standard deviation between pixels in these 2 images is 9.25. Please note the impact of the 'Update Interval' in this plot: It can be used to define a gap between 2 images to compare. E.g. if the update interval is set to 2, the differences between image 1 and 3, 3 and 5, 5 and 7 etc. will be calculated. In order to get the difference between 2 consecutive images the update interval must be set to 1!
- See also
- Other Drawing/Display Options
