Horizontal/Vertical Line Profile
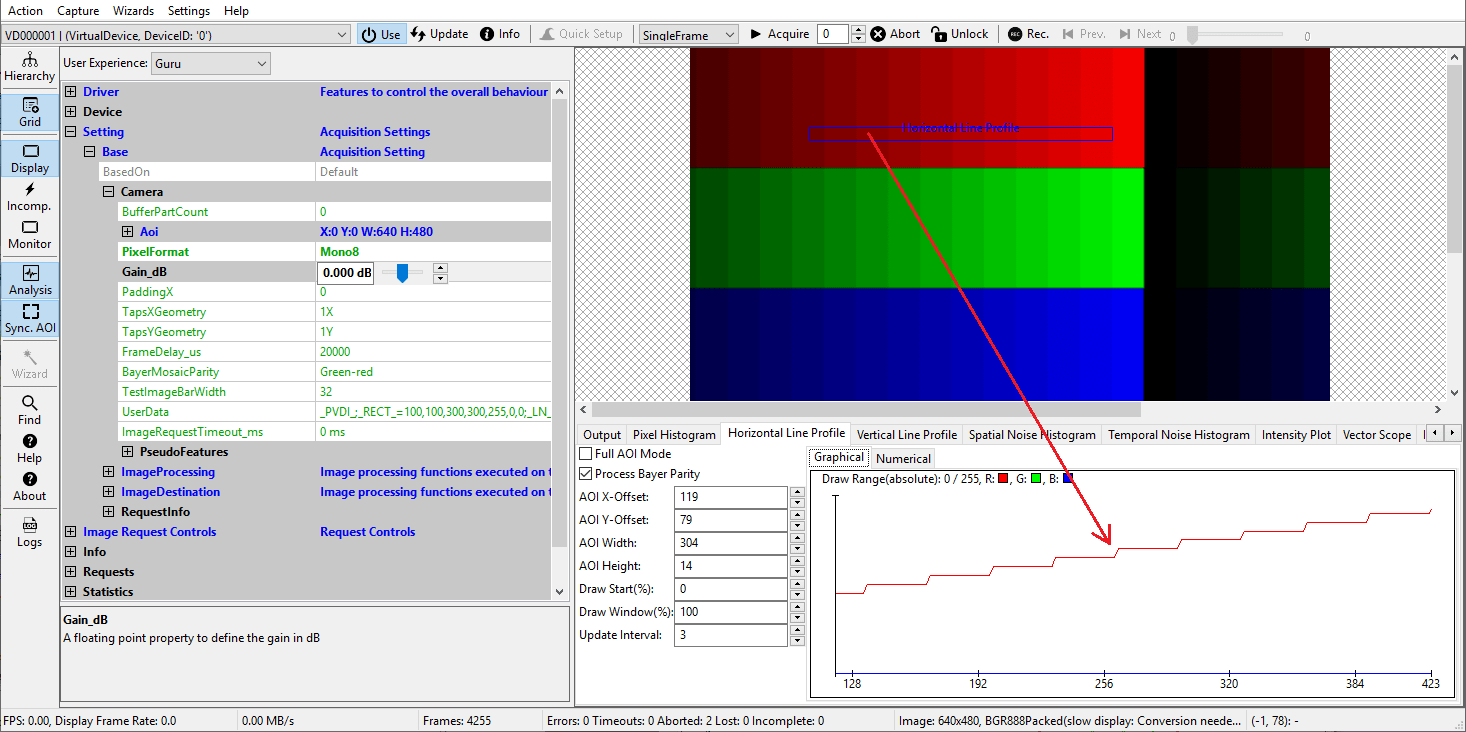
The horizontal and vertical line profile plots provide a way to visualize course of the intensity either in a horizontal or in a vertical direction:

In this example (horizontal line profile) each test image bar within the AOI results in a flat line of a certain intensity within the middle of the intensity range. Whenever a new intensity bar starts there is a sudden jump in intensity found as well in the profile.
Typically the AOI dimension in the other direction will be 1 but also any other value is possible. In that case the average value of the included range will be calculated.
- Note
- The profile lines can also be used to conveniently adjust the focus by looking at an edge and then try to adjust the lens in a way this edge has its maximum gradient.
- See also
- Other Drawing/Display Options
