Intensity Plot
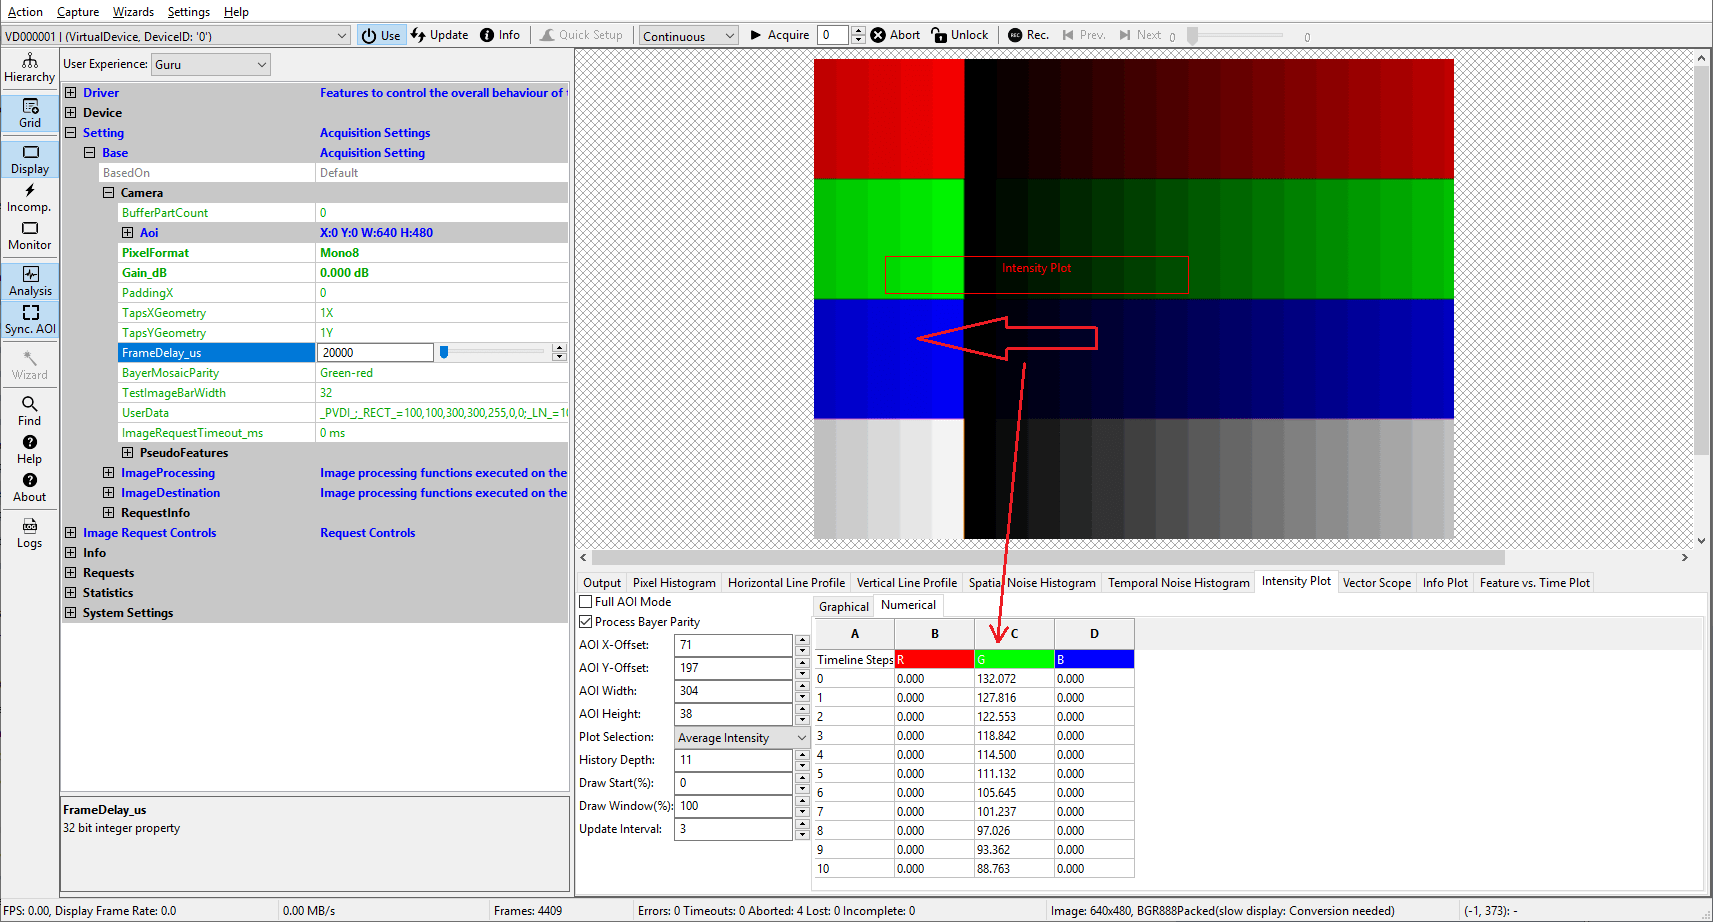
This plot can be used to display either the average intensity or the most frequent value of pixel data within a certain AOI over time:

There will be history depth entries, meaning the calculated data of the last history depth images or AOI movements will be stored and displayed. So assuming the color bar from the above image moves to the right a little with each new image right now this results in an ever increasing average green intensity since darker parts move out of the AOI while lighter ones enter it from the left. The red and blue components are 0 obviously since only the green color bar is within the AOI.
- See also
- Other Drawing/Display Options
